That dollar figure results from a 39.7% gain from $347.7 million 5 years earlier in 2019.
Year over year, overall spending on that military weaponry fell by -16.5% compared to $581.4 million starting from 2022.
The 5 biggest exporters of non-artillery military weapons are the United States of America, Belgium, Canada, United Kingdom and Poland. Combined, that quintet of leading international suppliers accounted for 86.2% of globally exported military weapons studied in this article. Such a high percentage indicates a concentrated cohort of weaponry exporters.
Applying a continental lens, suppliers in North America shipped the highest value of non-artillery military weapons at $281 million or 57.9% of worldwide exports for this commodity subcategory. In second place were sellers in Europe at 34.9% trailed by those in Asia (4.4%) and Africa (1.7%).
Smaller percentages came from providers in Latin America (0.9%) excluding Mexico but including the Caribbean, and competitors in Oceania’s Australia (0.3%).
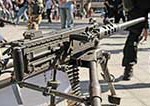
For research purposes, the 6-digit Harmonized Tariff System code prefix for military weapons is 930190. (That prefix covers sub-machine guns but excludes artillery weapons like rocket launchers and flame-throwers).
Top Military Weapons Exporters
Below are the 15 countries that exported the highest dollar value worth of military weapons (excluding artillery products such as rocket launchers and flame-throwers) during 2023.
- United States: US$221.8 million (45.7% of exported non-artillery military weapons)
- Belgium: $85.6 million (17.6%)
- Canada: $59.3 million (12.2%)
- United Kingdom: $36.8 million (7.6%)
- Poland: $15.4 million (3.2%)
- Slovakia: $12.3 million (2.5%)
- Switzerland: $11 million (2.3%)
- South Korea: $9.9 million (2%)
- Senegal: $4.8 million (1%)
- United Arab Emirates: $4.3 million (0.9%)
- Thailand: $3.9 million (0.8%)
- Indonesia: $2.9 million (0.6%)
- Portugal: $2.7 million (0.6%)
- Netherlands: $2.3 million (0.5%)
- Guyana: $2.2 million (0.5%)
By value, the listed 15 countries shipped 97.8% of all non-artillery military weapons exported in 2023.
Among the top suppliers, the fastest-growing exporters of non-artillery military weapons since 2022 were: Portugal (up 33,650%), United Arab Emirates (up 9,616%), Thailand (up 3,133%) and Indonesia (up 1,216%).
Major suppliers that posted declines in their international sales of non-artillery military weapons were: Switzerland (down -93.3% from 2022), Slovakia (down -67.4%) and the United States of America (down -10.1%).
Countries Earning Best Trade Surpluses from Military Weapons
The following countries posted the highest positive net exports for non-artillery military weapons during 2023. Investopedia defines net exports as the value of a country’s total exports minus the value of its total imports. Thus, the statistics below present the surplus between the value of each country’s exports of non-artillery military weapons and its import purchases for that same commodity.
- United States: US$205.1 million (net export surplus down -6% from 2022)
- Belgium: $84.2 million (up 50.6%)
- Canada: $55.6 million (up 1552.8%)
- Switzerland: $11 million (down -93.3%)
- Poland: $2.8 million (down -76.1%)
- Portugal: $2.7 million (down -112.6%)
- Senegal: $2.3 million (down -263%)
- Guyana: $2.2 million (2022 data unavailable)
- United Arab Emirates: $2 million (reversing a -$441,000 deficit)
- Mali: $1.4 million (reversing a -$9,000 deficit)
- Egypt: $1.2 million (reversing a -$673,000 deficit)
- Croatia: $1.1 million (down -84.6%)
- Netherlands: $696,000 (reversing a -$98,000 deficit)
- Chile: $502,000 (reversing a -$2,000 deficit)
- Uganda: $198,000 (reversing a -$12,000 deficit)
The United States of America generated the highest surplus in the international trade of military weapons. In turn, this positive cashflow confirms America’s strong competitive advantage for this specific product category.
Countries Causing Largest Trade Deficits from Military Weapons
The following countries posted the highest negative net exports for non-artillery military weapons during 2023. Investopedia defines net exports as the value of a country’s total exports minus the value of its total imports. Thus, the statistics below present the deficit between the value of each country’s imported non-artillery military weapons purchases and its exports for that same commodity.
- United Kingdom: -US$62.5 million (net export deficit up 10% from 2022)
- Indonesia: -$50.7 million (up 12.1%)
- Brazil: -$26.3 million (up 81.9%)
- South Korea: -$20.9 million (up 201.3%)
- Zambia: -$17.1 million (2022 data unavailable)
- Norway: -$9.9 million (up 22.3%)
- Australia: -$8.1 million (up 97.1%)
- Philippines: -$7.5 million (up 19.1%)
- Democratic Republic of Congo,: -$7.3 million (reversing a $674,000 surplus)
- Malaysia: -$6.7 million (up 2043.8%)
- Nigeria: -$6.1 million (down -23.6%)
- Spain: -$5.7 million (down -49.8%)
- New Zealand: -$5.4 million (up 237.1%)
- Oman: -$4.7 million (2022 data unavailable)
- Ivory Coast: -$4.3 million (down -9.6%)
The United Kingdom incurred the highest deficit in the international trade of non-artillery military weapons. In turn, this negative cashflow highlights the UK’s competitive disadvantage for this specific product category but also signals opportunities for non-artillery military weapons-supplying countries that help satisfy the powerful demand.
See also Aerospace Exports by Country, Top Industrial Robots Exporters and Top Fireworks Exporters
Research Sources:
Central Intelligence Agency, The World Factbook Field Listing: Exports – Commodities. Accessed on November 2, 2024
Forbes Global 2000 rankings, The World’s Biggest Public Companies. Accessed on November 2, 2024
International Trade Centre, Trade Map. Accessed on November 2, 2024
Investopedia, Net Exports Definition. Accessed on November 2, 2024